Look-up tables for image rendering
The following colormaps are available for use with luts.set() and luts.get().
In a few instances, multiple families offer like-named colormaps. In that case, you can prefix the name with the family, e.g., cm = qp.luts.get("misc.rainbow").
Most color maps are continuous, i.e., comprise an infinitesimally fine range of shades. Some are categorical, i.e., define a strictly finite number of shades, such as the “qualitative” family from Matplotlib. There are also colormaps that are categorical by default but may be used as continuous maps by asking for a specific number of shadings, such as the “carto” family from Plotly.
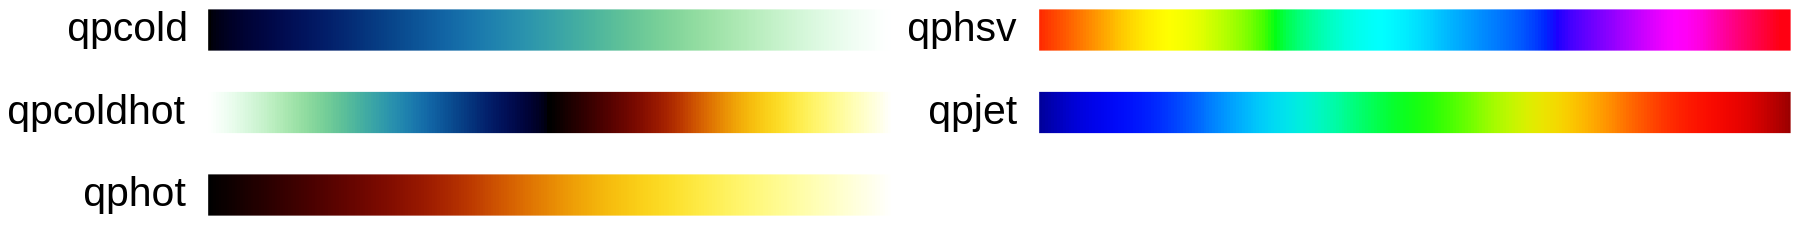
native
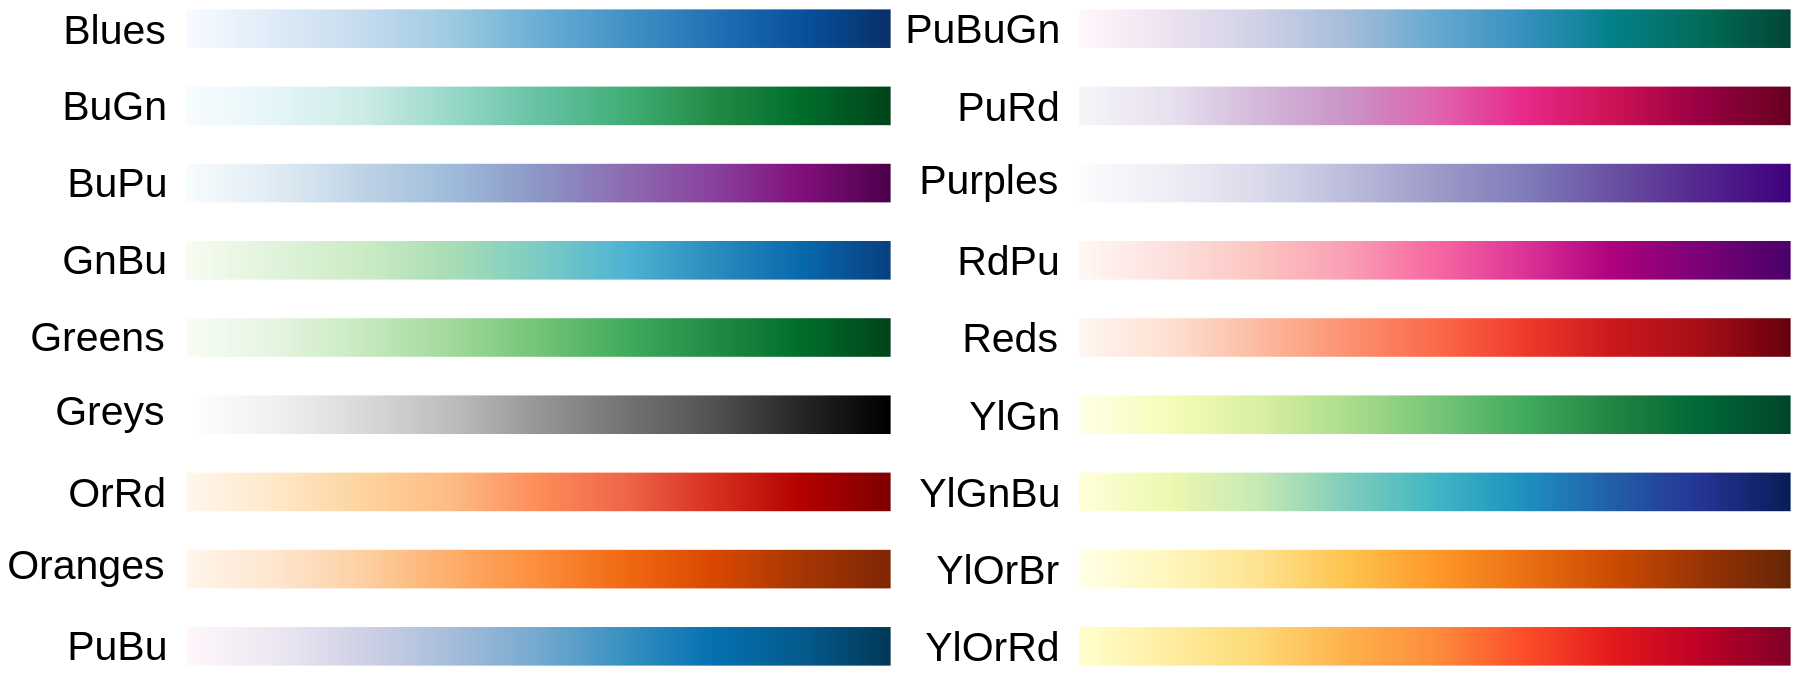
sequential.perceptuallyuniform

sequential.singlecolor
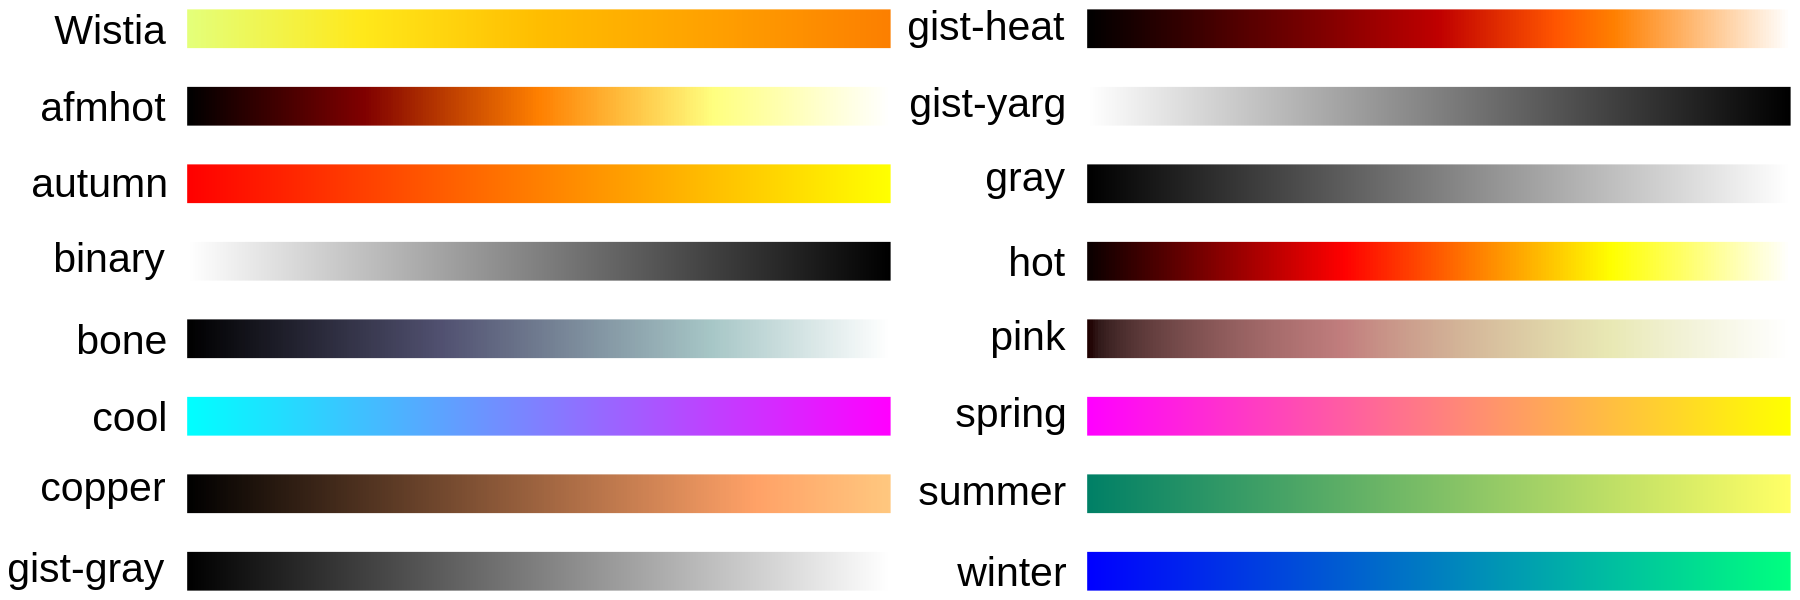
sequential.other
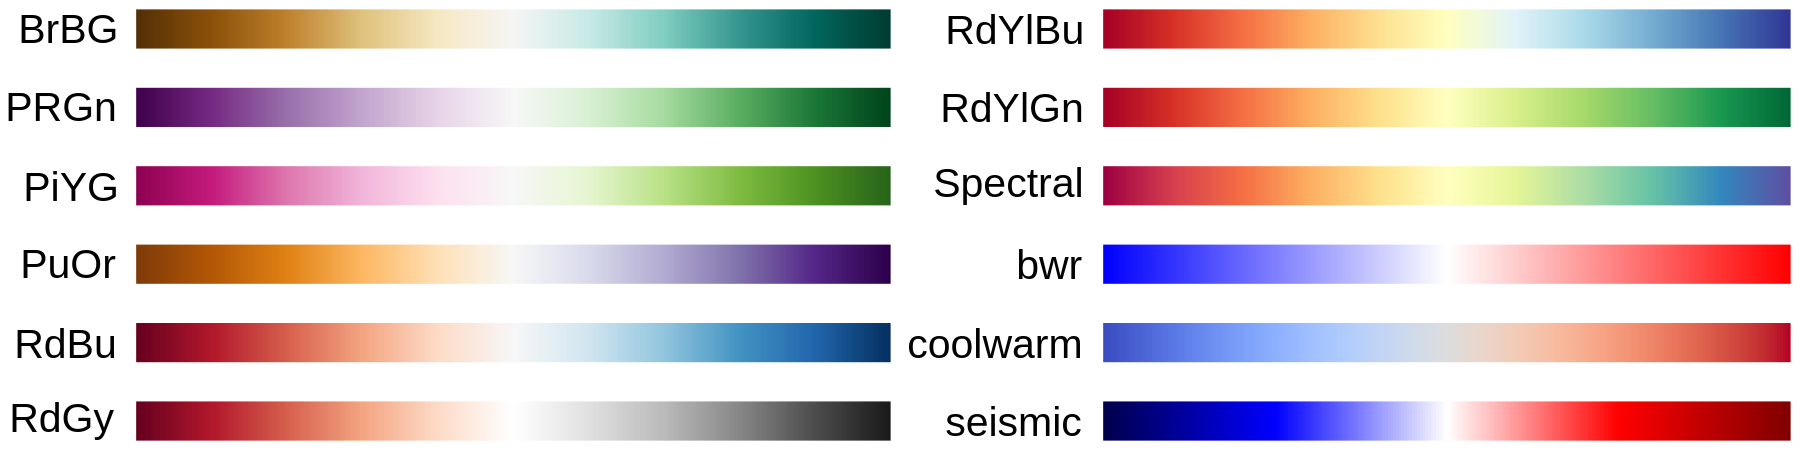
diverging
cyclic

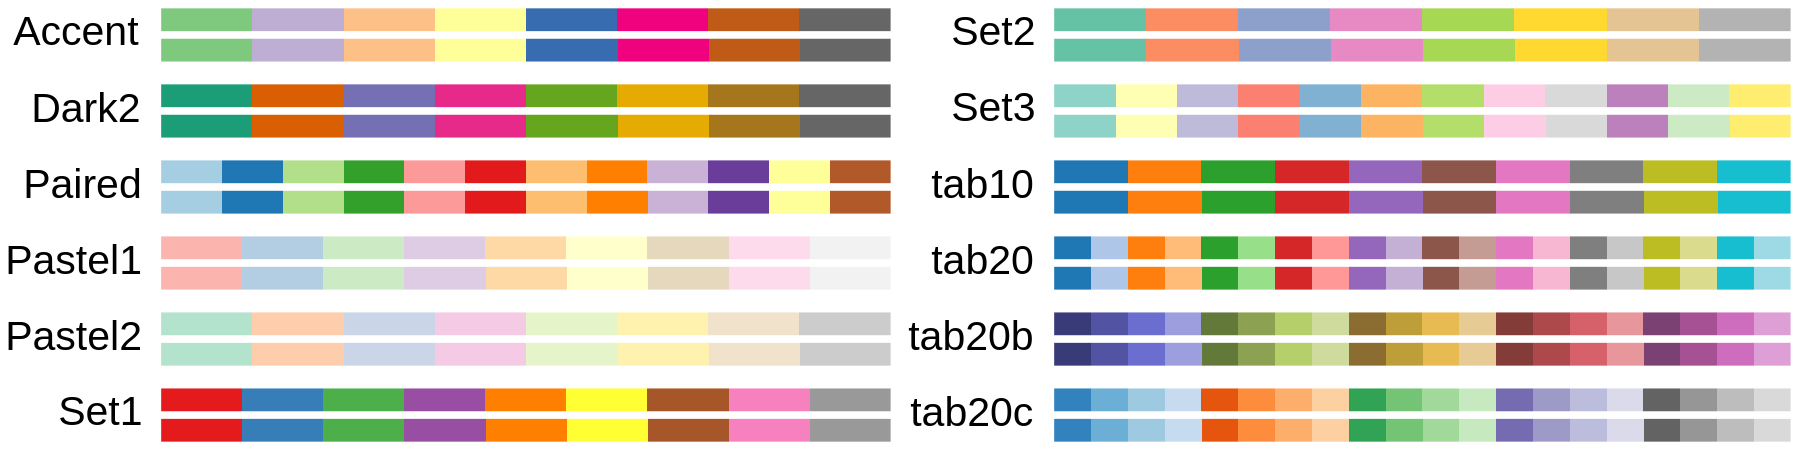
qualitative
misc
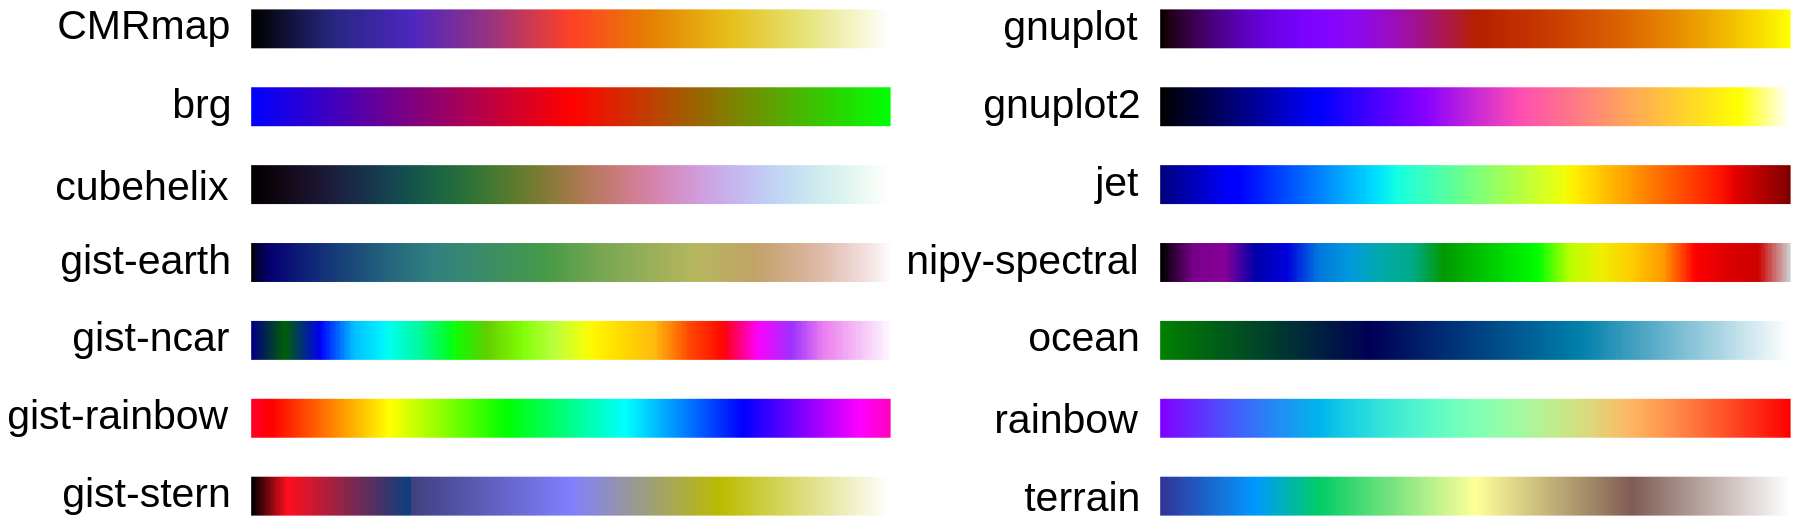
Only the “native” colormaps are strictly part of QPlot. The “sequential,” “diverging,” “cyclic,” “qualitative,” and “misc” colormaps are from Matplotlib. The “plotly,” “carto,” “cmocean,” and “colorbrewer” colormaps are from plotly. The “cet” colormaps are from colorcet. Non-native colormaps are only available if the respective libraries are installed on your computer. For copyright information on non-native colormaps, please refer to matplotlib.org, plotly.com, and colorcet.
Colormaps from other sources can also be used with QPlot. Excellent colormaps are provided, e.g., by the CMasher, cmcrameri, and cmyt projects. See also lut().