Imports
import numpy as np

import qplot as qp
Preparing the data
(Here we just make up some data for the demonstration.)
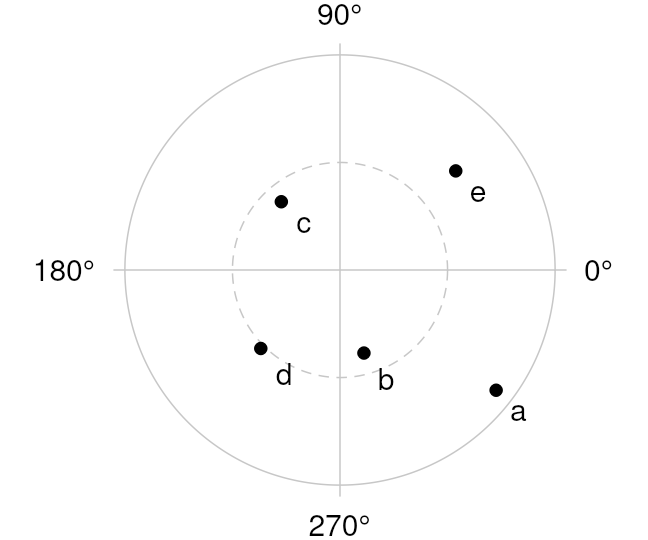
xy = np.array([

  [0.72584,  -0.559],

  [0.11131,  -.38611],

  [-.27279,  .31731],

  [-0.36819,  -0.36485],

  [.53813,   0.46068]])
Plotting
qp.figure('eg_circ', 3, 2.5)


# Draw the circular "axes"

phi = qp.arange(0, 2*np.pi, 0.01)

qp.pen('777', 0.5, pattern='dash')

qp.plot(0.5*np.cos(phi), 0.5*np.sin(phi))

qp.pen(pattern='solid')

qp.plot(np.cos(phi), np.sin(phi))

qp.plot(1.05*np.array([-1, 1]), [0, 0])

qp.plot([0, 0], 1.05*np.array([-1, 1]))


# Draw the data

qp.pen()

qp.marker('o', 4, 'solid')

qp.mark(xy[:,0], xy[:,1])


# Label the data

for k, (x,y) in enumerate(xy):

  qp.at(x, y)

  qp.align('left', 'top')

  qp.text(chr(ord('a') + k), dx=5, dy=5)


# Label the axes

qp.at(1, 0)

qp.align('left', 'middle')

qp.text('0°', dx=10)


qp.at(-1, 0)

qp.align('right', 'middle')

qp.text('180°', dx=-10)


qp.at(0, 1)

qp.align('center', 'bottom')

qp.text('90°', dy=-10)


qp.at(0, -1)

qp.align('center', 'top')

qp.text('270°', dy=10)


# Ensure annotations fit inside bounding box while preserving aspect ratio

qp.shrink(ratio=1)