Example: Data and guides
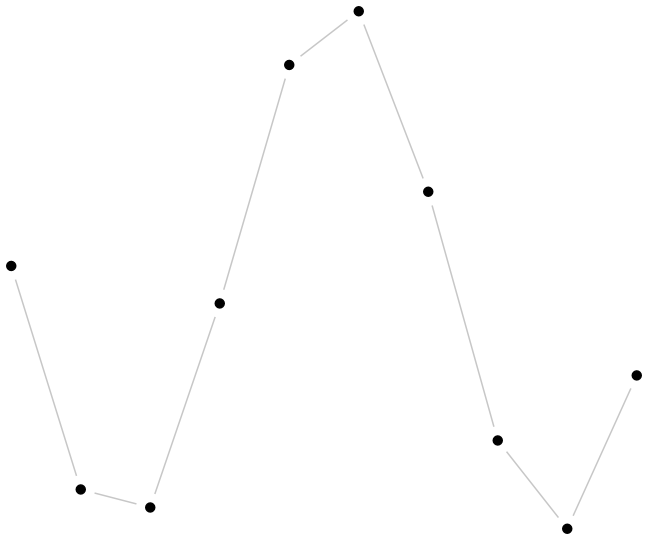
This example shows off QPlot’s somewhat esoteric “generalized line drawing” functionality.
Imports
import numpy as np

import qplot as qp
Preparing the data
(Here we just make up some data for the demonstration.)
xx = qp.arange(-1.5*np.pi, 1.5*np.pi, 1)

yy = np.cos(xx)
Plotting
qp.figure('eg_gline', 3, 2.5)
# Draw the data
qp.marker('o', 3, 'solid')
qp.mark(xx, yy)
# Connect with lines that stay 5 pt away from the data points
qp.pen('777')
qp.gline2(qp.AbsData(xx, yy), qp.Retract(5))
# Make sure annotations fit inside bounding box
# (Not actually needed in this case, but good practice in general)