Example: Electrophysiology
Imports
import ppersist

import numpy as np

import qplot as qp
Loading data
I_nA, V_mV, fs_Hz = ppersist.load("../../data/ephys.pkl")

N = len(I_nA)

tt_ms = np.arange(N) * 1000 / fs_Hz
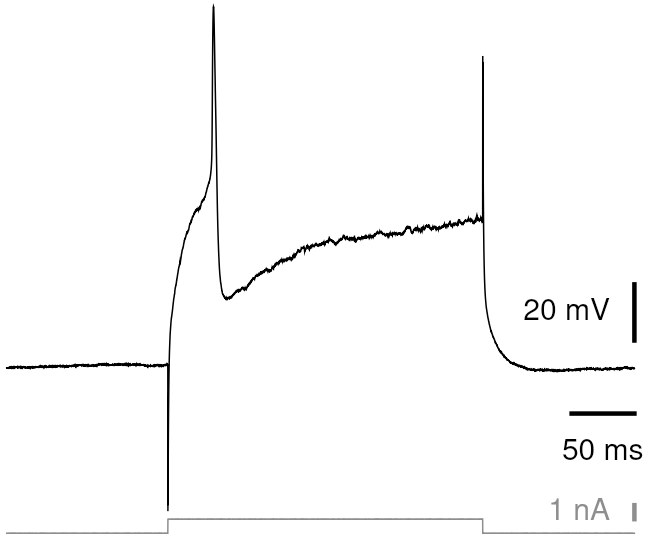
Plotting the graph
qp.figure('eg_ephys', 3, 2.5);
# Draw voltage trace
qp.pen('k', 0.5)
qp.brush('k')
qp.plot(tt_ms, V_mV);
# Draw current trace below it
qp.pen('555')
v1 = min(V_mV)
qp.plot(tt_ms, 5 * I_nA + v1 - 10);
# Draw scale bar for current
qp.pen(width=1.5)
t1 = tt_ms[-1]
qp.yaxis('1 nA', [], lim=[v1 - 5, v1], x=t1, titlerot=0)
# Draw scale bar for voltage
qp.pen('k')
v1 = V_mV[-1] + 10
qp.yaxis('20 mV', [], lim=[v1, v1 + 20], x=t1, titlerot=0)
# Draw scale bar for time
qp.xaxis('50 ms', [], lim=[t1 - 50, t1], y=v1 - 10, axshift=15)
# Make sure annotations fit inside bounding box